At present, there are a total of 64 survey areas selected for the vector surveillance throughout the territory and the following four different indices will be enumerated:
- Area Gravidtrap Index for Aedes albopictus (AGI),
- Area Density Index for Aedes albopictus (ADI),
- Monthly Gravidtrap Index for Aedes albopictus (MGI), and
- Monthly Density Index for Aedes albopictus (MDI).
The AGI and ADI indicate the extensiveness of the distribution and density of Aedine mosquitoes respectively in that particular survey area, while the MGI and MDI are enumerated by pooling together all AGIs and ADIs of the same month reflecting the territory-wide situation of Aedes albopictus.
In addition to the areas in the community, surveys of Aedes albopictus are also carried out to cover all major port areas. The following two different groups of indices will be enumerated:
- Port / Monthly Port Gravidtrap Index for Aedes albopictus (PGI/MPGI), and
- Port / Monthly Port Density Index for Aedes albopictus (PDI/MPDI).
The Port Gravidtrap Index for Aedes albopictus (PGI) indicates the extensiveness of the distribution of Aedine mosquitoes in a particular group of port areas. The Monthly Port Gravidtrap Index for Aedes albopictus (MPGI) is enumerated by pooling together all PGIs of the same month, which reflects the overall degree of occurrence of Aedes albopictus in port areas. Another index, the Port Density Index for Aedes albopictus (PDI) indicates the density of Aedes albopictus in positive traps in a particular group of port areas. The Monthly Port Density Index for Aedes albopictus (MPDI) is enumerated by pooling together all PDIs of the same month, which denotes the overall density of Aedes albopictus in locales detected with Aedine mosquito activities in port areas.
The Gravidtrap Index for Aedes albopictus is divided into four levels, reflecting the distribution level of the Aedes albopictus. Level 1 (less than 5 per cent) indicates that distribution of Aedes albopictus is not extensive in the area surveyed. Level 2 (5 per cent to less than 20 per cent) indicates that distribution of Aedes albopictus is fairly extensive in the area surveyed. Level 3 (20 per cent to less than 40 per cent) indicates that distribution of Aedes albopictus is extensive in the area surveyed. Level 4 (40 per cent or above) indicates that distribution of Aedes albopictus is very extensive in the area surveyed. Specific preventive and control measures will be initiated accordingly. Management of housing estates, hospitals, schools, construction sites and other venues or properties are also advised to take specific measures to contain mosquito problems in their own properties. The four levels of Gravidtrap Index for Aedes albopictus and actions to be taken by the management are listed in the following table.
| Level | Gravidtrap Index for Aedes albopictus | Actions to be taken |
|---|---|---|
| 1 | G.I. < 5% (Distribution of Aedes albopictus in the survey area is not extensive) |
|
| 2 | 5% ≤ G.I. < 20% (Distribution of Aedes albopictus in the survey area is fairly extensive) |
|
| 3 | 20% ≤ G.I. < 40% (Distribution of Aedes albopictus in the survey area is extensive) |
|
| 4 | G.I. ≥ 40% (Distribution of Aedes albopictus in the survey area is very extensive) |
With the adoption of Gravidtraps since April 2020, a new index called the Density Index (DI) is also recorded in each survey area. It is denoted as Area Density Index (ADI) which is enumerated by dividing the number of adult Aedes by the total number of Aedes positive Gravidtraps during the survey period. The minimum value of the index is one.
The Density Index for Aedes albopictus is divided into three levels, reflecting the abundancy of Aedes albopictus. Level 1 (1 to 1.5) indicates that mosquito is not abundant in the locations with positive Gravidtraps. Level 2 (1.6 to 2.4) indicates that mosquito is slightly abundant in the locations with positive Gravidtraps. Level 3 (2.5 or above) indicates that mosquito is abundant in the locations with positive Gravidtraps. Specific preventive and control measures will be initiated accordingly. Management of housing estates, hospitals, schools, construction sites and other venues or properties will also be advised to take specific measures to contain mosquito problems in their own properties. The three levels of DI and actions to be taken by the management are listed in the following table.
| Level | Density Index for Aedes albopictus | Actions to be taken |
|---|---|---|
| 1 |
1 ≤ D.I. ≤ 1.5 |
|
| 2 |
1.6 ≤ D.I. ≤ 2.4 |
|
| 3 |
D.I. ≥ 2.5 |
|
Public should refer to the “Action to be taken” for AGI as primary reference. If both indices are of similar levels, their actions are also similar. However, if the AGI is low, e.g. Level 1 or Level 2, but level of ADI is high, e.g. Level 3, public should carry out actions for corresponding level of AGIs and supplement with actions for higher level of ADI, e.g. fogging, in locations with high mosquito density.
Area Gravidtrap Indices and Density Indices for Aedes albopictus for the 64 survey areas in 2023 are provided below:
| Hong Kong Island (Map) | ||||||||||||||
|---|---|---|---|---|---|---|---|---|---|---|---|---|---|---|
| District | Survey Area | Jan | Feb | Mar | Apr | May | Jun | Jul | Aug | Sep | Oct | Nov | Dec | |
| Central/Western | Central and Admiralty | AGI | 0.0 | 0.0 | 0.0 | 3.8 | 9.0 | 9.6 | 5.8 | 10.7 | ||||
| ADI | N/A | N/A | N/A | 1.0 | 1.0 | 1.8 | 1.2 | 1.0 | ||||||
| Sheung Wan and Sai Ying Pun | AGI | 0.0 | 0.0 | 0.0 | 3.4 | 15.2 | 13.9 | 5.3 | 1.7 | |||||
| ADI | N/A | N/A | N/A | 1.0 | 1.3 | 1.4 | 1.0 | 1.0 | ||||||
| Sai Wan | AGI | 0.0 | 0.0 | 1.0 | 10.4 | 28.4 | 23.1 | 11.4 | 9.5 | |||||
| ADI | N/A | N/A | 1.0 | 1.1 | 1.5 | 1.5 | 1.1 | 1.2 | ||||||
| Eastern | Chai Wan West | AGI | 0.0 | 0.0 | 0.0 | 2.6 | 14.9 | 17.0 | 8.9 | 9.7 | ||||
| ADI | N/A | N/A | N/A | 1.0 | 1.0 | 1.0 | 1.0 | 1.0 | ||||||
| AGI | 4.4 | 0.0 | 0.9 | 3.6 | 16.5 | 33.9 | 20.0 | 8.8 | ||||||
| ADI | 1.0 | N/A | 1.0 | 1.0 | 1.2 | 1.4 | 1.0 | 1.0 | ||||||
| North Point | AGI | 0.0 | 0.0 | 0.0 | 0.0 | 7.9 | 12.8 | 18.4 | 5.7 | |||||
| ADI | N/A | N/A | N/A | N/A | 1.3 | 1.3 | 1.2 | 1.0 | ||||||
| Southern | Aberdeen and Ap Lei Chau | AGI | 0.0 | 0.0 | 0.0 | 0.0 | 9.1 | 15.9 | 7.8 | 7.4 | ||||
| ADI | N/A | N/A | N/A | N/A | 1.3 | 1.4 | 1.1 | 1.3 | ||||||
| Pokfulam | AGI | 0.0 | 0.9 | 2.6 | 7.0 | 8.8 | 17.9 | 9.9 | 12.8 | |||||
| ADI | N/A | 1.0 | 1.0 | 1.0 | 1.4 | 1.3 | 1.0 | 1.1 | ||||||
| Deep Water Bay and Repulse Bay | AGI | 0.0 | 0.0 | 0.8 | 5.2 | 14.5 | 28.0 | 8.5 | 7.6 | |||||
| ADI | N/A | N/A | 1.0 | 1.0 | 1.0 | 1.0 | 1.0 | 1.0 | ||||||
| Wanchai | Tin Hau | AGI | 0.0 | 0.0 | 1.0 | 3.8 | 18.5 | 15.4 | 16.3 | 10.6 | ||||
| ADI | N/A | N/A | 1.0 | 1.3 | 1.4 | 1.9 | 2.0 | 1.7 | ||||||
| Wan Chai North | AGI | 0.0 | 0.0 | 0.0 | 1.9 | 8.2 | 7.2 | 6.6 | 1.8 | |||||
| ADI | N/A | N/A | N/A | 1.0 | 1.0 | 1.5 | 1.0 | 1.0 | ||||||
| Happy Valley | AGI | 0.0 | 0.0 | 0.0 | 3.6 | 11.6 | 19.8 | 13.8 | 8.2 | |||||
| ADI | N/A | N/A | N/A | 1.0 | 1.5 | 1.5 | 1.1 | 1.2 | ||||||
| Islands (Map) | ||||||||||||||
| District | Survey Area | Jan | Feb | Mar | Apr | May | Jun | Jul | Aug | Sep | Oct | Nov | Dec | |
| Islands | Cheung Chau South (Formerly: Cheung Chau) |
AGI | 0.0 | 0.0 | 0.0 | 6.6 | 19.7 | 16.7 | 3.1 | 3.1 | ||||
| ADI | N/A | N/A | N/A | 1.0 | 1.3 | 1.1 | 1.0 | 2.0 | ||||||
| Cheung Chau North | AGI | 0.0 | 0.0 | 0.0 | 7.5 | 15.7 | 14.5 | 6.0 | 5.9 | |||||
| ADI | N/A | N/A | N/A | 1.4 | 1.3 | 2.3 | 1.3 | 1.0 | ||||||
| Tung Chung | AGI | 0.0 | 0.0 | 0.0 | 1.0 | 9.7 | 14.4 | 5.4 | 0.0 | |||||
| ADI | N/A | N/A | N/A | 2.0 | 1.0 | 1.4 | 1.2 | N/A | ||||||
| Kowloon (Map) | ||||||||||||||
| District | Survey Area | Jan | Feb | Mar | Apr | May | Jun | Jul | Aug | Sep | Oct | Nov | Dec | |
| Yau Tsim | Tsim Sha Tsui | AGI | 0.0 | 0.0 | 0.0 | 4.1 | 8.1 | 10.2 | 10.7 | 7.2 | ||||
| ADI | N/A | N/A | N/A | 1.0 | 2.4 | 1.0 | 1.0 | 1.3 | ||||||
| Tsim Sha Tsui East | AGI | 0.0 | 0.0 | 0.0 | 4.8 | 15.0 | 16.7 | 18.6 | 6.7 | |||||
| ADI | N/A | N/A | N/A | 1.4 | 1.6 | 1.4 | 1.3 | 1.0 | ||||||
| Mong Kok | Mong Kok | AGI | 0.0 | 0.0 | 0.0 | 0.9 | 5.7 | 6.7 | 6.6 | 2.5 | ||||
| ADI | N/A | N/A | N/A | 1.0 | 1.9 | 1.0 | 1.6 | 1.0 | ||||||
| Sham Shui Po | Cheung Sha Wan | AGI | 0.0 | 0.0 | 0.0 | 2.6 | 9.9 | 17.9 | 5.4 | 1.8 | ||||
| ADI | N/A | N/A | N/A | 1.0 | 1.2 | 1.4 | 1.3 | 1.0 | ||||||
| Lai Chi Kok | AGI | 0.0 | 0.0 | 0.0 | 1.8 | 1.8 | 8.9 | 1.9 | 1.0 | |||||
| ADI | N/A | N/A | N/A | 1.5 | 3.0 | 1.0 | 1.0 | 1.0 | ||||||
| Sham Shui Po East | AGI | 0.0 | 0.0 | 0.0 | 12.3 | 16.2 | 12.4 | 8.4 | 5.7 | |||||
| ADI | N/A | N/A | N/A | 1.0 | 1.1 | 1.1 | 1.1 | 1.0 | ||||||
| Kowloon City | Ho Man Tin | AGI | 0.0 | 0.0 | 0.0 | 7.8 | 20.2 | 21.1 | 19.0 | 1.9 | ||||
| ADI | N/A | N/A | N/A | 1.0 | 1.5 | 1.3 | 1.2 | 1.0 | ||||||
| Kowloon City North | AGI | 0.0 | 0.0 | 0.0 | 2.8 | 12.0 | 8.3 | 3.8 | 2.7 | |||||
| ADI | N/A | N/A | N/A | 1.0 | 1.2 | 1.0 | 1.0 | 1.0 | ||||||
| Hung Hom | AGI | 0.9 | 0.0 | 0.9 | 3.7 | 23.4 | 15.3 | 14.4 | 1.8 | |||||
| ADI | 1.0 | N/A | 1.0 | 1.8 | 1.7 | 1.3 | 1.1 | 1.0 | ||||||
| Lok Fu West | AGI | 0.0 | 0.0 | 1.7 | 11.6 | 25.4 | 5.9 | 2.6 | 3.3 | |||||
| ADI | N/A | N/A | 1.0 | 1.2 | 1.2 | 1.3 | 1.0 | 1.3 | ||||||
| Kai Tak North | AGI | 3.8 | 1.4 | 0.0 | 6.4 | 22.5 | 16.7 | 2.7 | 3.8 | |||||
| ADI | 1.0 | 1.0 | N/A | 1.2 | 1.2 | 1.2 | 1.0 | 1.0 | ||||||
| Wong Tai Sin | Wong Tai Sin Central | AGI | 0.0 | 0.0 | 0.0 | 4.6 | 15.2 | 23.4 | 8.8 | 5.6 | ||||
| ADI | N/A | N/A | N/A | 1.0 | 1.9 | 1.9 | 1.4 | 1.0 | ||||||
| Wong Tai Sin West | AGI | 0.0 | 0.0 | 0.0 | 2.8 | 14.2 | 24.1 | 14.4 | 3.8 | |||||
| ADI | N/A | N/A | N/A | 1.0 | 1.5 | 1.0 | 1.0 | 1.0 | ||||||
| Diamond Hill | AGI | 0.0 | 0.0 | 0.0 | 1.7 | 6.9 | 15.7 | 7.1 | 3.4 | |||||
| ADI | N/A | N/A | N/A | 1.0 | 1.0 | 1.0 | 1.3 | 1.0 | ||||||
| Ngau Chi Wan | AGI | 0.0 | 0.0 | 0.0 | 4.5 | 12.3 | 16.4 | 13.1 | 8.3 | |||||
| ADI | N/A | N/A | N/A | 1.0 | 1.2 | 1.5 | 1.4 | 1.3 | ||||||
| Kwun Tong | Kwun Tong Central | AGI | 0.0 | 0.0 | 0.0 | 0.8 | 11.9 | 11.2 | 8.3 | 4.8 | ||||
| ADI | N/A | N/A | N/A | 1.0 | 1.3 | 1.2 | 1.1 | 1.0 | ||||||
| Lam Tin | AGI | 0.0 | 0.0 | 0.0 | 4.3 | 9.5 | 13.9 | 13.7 | 8.5 | |||||
| ADI | N/A | N/A | N/A | 2.4 | 1.4 | 1.8 | 1.3 | 1.3 | ||||||
| Yau Tong | AGI | 0.0 | 0.0 | 0.0 | 2.8 | 16.2 | 20.5 | 4.3 | 8.6 | |||||
| ADI | N/A | N/A | N/A | 1.0 | 1.0 | 1.7 | 1.0 | 1.0 | ||||||
| Kowloon Bay | AGI | 0.0 | 0.0 | 1.6 | 5.9 | 10.9 | 21.2 | 4.3 | 4.1 | |||||
| ADI | N/A | N/A | 1.0 | 1.0 | 1.3 | 1.1 | 1.0 | 1.0 | ||||||
| New Territories (Map) | ||||||||||||||
| District | Survey Area | Jan | Feb | Mar | Apr | May | Jun | Jul | Aug | Sep | Oct | Nov | Dec | |
| Sai Kung | Tseung Kwan O West (Formerly: Tseung Kwan O South) |
AGI | 0.0 | 0.0 | 0.0 | 16.4 | 7.4 | 21.5 | 15.6 | 2.8 | ||||
| ADI | N/A | N/A | N/A | 1.2 | 2.0 | 1.0 | 1.0 | 1.0 | ||||||
| Tseung Kwan O East | AGI | 0.0 | 0.9 | 0.0 | 5.4 | 18.0 | 21.8 | 8.3 | 9.9 | |||||
| ADI | N/A | 1.0 | N/A | 1.0 | 1.2 | 1.3 | 1.0 | 1.4 | ||||||
| Tseung Kwan O North | AGI | 0.0 | 0.0 | 0.0 | 11.5 | 25.0 | 29.9 | 14.9 | 7.4 | |||||
| ADI | N/A | N/A | N/A | 1.1 | 1.5 | 1.3 | 1.0 | 1.3 | ||||||
| Sai Kung Town | AGI | 0.0 | 0.0 | 0.9 | 31.1 | 40.4 | 7.5 | 4.7 | 8.6 | |||||
| ADI | N/A | N/A | 1.0 | 1.8 | 1.9 | 1.0 | 1.4 | 1.2 | ||||||
| Ngau Liu and Muk Min Shan | AGI | 0.0 | 2.1 | 0.0 | 55.3 | 44.0 | 14.3 | 4.1 | 16.7 | |||||
| ADI | N/A | 1.0 | N/A | 1.5 | 1.6 | 1.3 | 1.0 | 1.0 | ||||||
| Sha Tin | Tai Wai | AGI | 0.0 | 0.8 | 1.6 | 5.6 | 19.7 | 15.0 | 16.0 | 5.7 | ||||
| ADI | N/A | 1.0 | 1.0 | 1.0 | 2.0 | 1.6 | 1.4 | 1.0 | ||||||
| Sha Tin East | AGI | 0.0 | 0.0 | 0.0 | 0.8 | 1.6 | 7.5 | 5.8 | 3.3 | |||||
| ADI | N/A | N/A | N/A | 1.0 | 1.0 | 1.0 | 1.0 | 1.0 | ||||||
| Ma On Shan | AGI | 1.7 | 2.5 | 0.0 | 5.6 | 15.8 | 15.1 | 15.9 | 1.6 | |||||
| ADI | 1.0 | 1.0 | N/A | 1.4 | 1.3 | 1.1 | 1.3 | 1.0 | ||||||
| Sha Tin Town Centre and Fo Tan | AGI | 0.0 | 1.9 | 0.0 | 2.9 | 21.4 | 17.5 | 13.2 | 10.3 | |||||
| ADI | N/A | 1.0 | N/A | 1.0 | 1.2 | 1.6 | 1.1 | 1.0 | ||||||
| Tai Po | Tai Po West | AGI | 0.0 | 0.0 | 0.9 | 10.5 | 17.4 | 16.4 | 10.4 | 7.1 | ||||
| ADI | N/A | N/A | 1.0 | 1.0 | 1.0 | 1.0 | 1.0 | 1.0 | ||||||
| Tai Po East | AGI | 0.0 | 0.0 | 0.0 | 3.0 | 16.2 | 10.6 | 13.0 | 6.7 | |||||
| ADI | N/A | N/A | N/A | 1.0 | 1.6 | 1.5 | 1.5 | 1.0 | ||||||
| North | Fanling | AGI | 0.0 | 0.0 | 0.9 | 8.1 | 32.5 | 2.7 | 12.6 | 4.5 | ||||
| ADI | N/A | N/A | 1.0 | 1.0 | 2.5 | 1.0 | 1.2 | 1.4 | ||||||
| Sheung Shui | AGI | 1.8 | 1.7 | 0.0 | 19.3 | 34.5 | 18.3 | 22.6 | 11.2 | |||||
| ADI | 1.0 | 1.0 | N/A | 1.5 | 1.4 | 1.0 | 1.9 | 1.0 | ||||||
| Yuen Long | Tin Shui Wai | AGI | 0.0 | 0.0 | 0.0 | 7.1 | 19.0 | 18.3 | 8.7 | 18.3 | ||||
| ADI | N/A | N/A | N/A | 1.0 | 1.0 | 1.0 | 1.0 | 1.0 | ||||||
| Yuen Kong | AGI | 0.0 | 0.0 | 0.0 | 6.3 | 6.1 | 14.3 | 2.0 | 4.0 | |||||
| ADI | N/A | N/A | N/A | 1.0 | 1.0 | 1.1 | 1.0 | 1.0 | ||||||
| Yuen Long Town | AGI | 0.0 | 1.0 | 0.0 | 7.8 | 31.2 | 27.3 | 5.0 | 2.7 | |||||
| ADI | N/A | 1.0 | N/A | 1.4 | 1.6 | 1.2 | 1.4 | 1.0 | ||||||
| Ki Lun Shan | AGI | 0.0 | 2.0 | 0.0 | 6.0 | 12.0 | 20.0 | 2.0 | 6.1 | |||||
| ADI | N/A | 1.0 | N/A | 1.3 | 1.0 | 1.2 | 1.0 | 1.0 | ||||||
| Sung Shan | AGI | 0.0 | 0.0 | 2.1 | 19.6 | 14.6 | 14.3 | 2.1 | 4.2 | |||||
| ADI | N/A | N/A | 1.0 | 2.1 | 1.1 | 1.1 | 1.0 | 1.0 | ||||||
| Tuen Mun | Tuen Mun North | AGI | 0.0 | 0.0 | 0.0 | 2.4 | 8.6 | 8.6 | 5.7 | 1.6 | ||||
| ADI | N/A | N/A | N/A | 1.3 | 1.1 | 1.0 | 1.0 | 1.0 | ||||||
| Tuen Mun South | AGI | 0.0 | 0.0 | 0.0 | 1.9 | 8.3 | 6.5 | 4.8 | 0.0 | |||||
| ADI | N/A | N/A | N/A | 1.5 | 1.1 | 1.0 | 1.0 | N/A | ||||||
| Tuen Mun West | AGI | 2.1 | 0.0 | 1.1 | 21.3 | 21.1 | 25.5 | 9.5 | 1.1 | |||||
| ADI | 1.0 | N/A | 1.0 | 1.2 | 1.4 | 1.6 | 1.1 | 1.0 | ||||||
| So Kwun Wat | AGI | 0.9 | 0.0 | 0.0 | 32.2 | 33.3 | 24.5 | 4.5 | 4.5 | |||||
| ADI | 1.0 | N/A | N/A | 1.6 | 1.3 | 1.3 | 1.0 | 1.0 | ||||||
| Tsuen Wan | Tsuen Wan Town | AGI | 0.0 | 0.0 | 0.0 | 0.9 | 6.9 | 5.3 | 5.3 | 4.3 | ||||
| ADI | N/A | N/A | N/A | 1.0 | 1.3 | 1.3 | 1.5 | 1.2 | ||||||
| Tseun Wan West | AGI | 0.0 | 0.9 | 0.0 | 22.1 | 22.3 | 24.2 | 12.9 | 9.7 | |||||
| ADI | N/A | 1.0 | N/A | 1.9 | 1.9 | 1.3 | 1.2 | 1.0 | ||||||
| Ma Wan | AGI | 2.0 | 4.2 | 0.0 | 4.0 | 21.3 | 30.6 | 0.0 | 2.0 | |||||
| ADI | 1.0 | 1.0 | N/A | 1.0 | 1.3 | 1.3 | N/A | 1.0 | ||||||
| Sheung Kwai Chung | AGI | 0.0 | 0.0 | 0.0 | 17.9 | 29.0 | 27.5 | 4.7 | 4.7 | |||||
| ADI | N/A | N/A | N/A | 1.4 | 1.6 | 1.2 | 1.2 | 1.0 | ||||||
| Kwai Tsing | Kwai Chung | AGI | 0.0 | 0.0 | 0.0 | 2.6 | 13.8 | 12.1 | 5.3 | 6.0 | ||||
| ADI | N/A | N/A | N/A | 1.0 | 1.0 | 1.0 | 1.0 | 1.0 | ||||||
| Lai King | AGI | 0.0 | 0.0 | 0.0 | 22.1 | 28.3 | 27.1 | 6.7 | 4.7 | |||||
| ADI | N/A | N/A | N/A | 1.1 | 1.4 | 1.4 | 1.1 | 1.0 | ||||||
| Tsing Yi South | AGI | 0.0 | 0.0 | 0.0 | 1.8 | 12.1 | 18.4 | 2.8 | 3.7 | |||||
| ADI | N/A | N/A | N/A | 1.0 | 1.2 | 1.0 | 1.0 | 1.3 | ||||||
| Tsing Yi North | AGI | 0.0 | 0.9 | 0.0 | 14.7 | 22.9 | 14.7 | 7.3 | 8.3 | |||||
| ADI | N/A | 1.0 | N/A | 1.3 | 1.6 | 1.2 | 1.0 | 1.1 | ||||||
Remarks:
Gravidtrap Index figures in green: Level I : Gravidtrap Index <5.0% (indicates that the distribution of Aedes albopictus in the survey area is not extensive)
Gravidtrap Index figures in yellow: Level II : 5.0% ≤ Gravidtrap Index <20.0% (indicates that the distribution of Aedes albopictus in the survey area is fairly extensive)
Gravidtrap Index figures in red: Level III : 20.0%≤ Gravidtap Index <40.0% ( indicates that the distribution of Aedes albopictus in the survey area is extensive)
Gravidtrap Index figures in purple: Level IV : Gravidtrap Index ≥40.0% (indicates that the distribution of Aedes albopictus is very extensive)
Density Index figures in green: Level I : 1.0 ≤ Density Index ≤ 1.5 (Aedes albopictus is not abundant in the locations with positive Gravidtraps)
Density Index figures in yellow: Level II : 1.6 ≤ Density Index ≤ 2.4 (Aedes albopictus is slightly abundant in the locations with positive Gravidtraps)
Density Index figures in red: Level III : Density Index ≥ 2.5 (Aedes albopictus is abundant in the locations with positive Gravidtraps)
Number of areas in respective levels of Survey Area Gravidtrap Indices in 2023 are provided below:
| Number of survey areas recorded with respective Index Level | Total number of survey areas | Top 5 survey areas at level 3 | Top 5 survey areas at level 4 | ||||
|---|---|---|---|---|---|---|---|
| Level 1 | Level 2 | Level 3 | Level 4 | ||||
| 0%-<5% | 5%-<20% | 20%-<40% | ≥40% | ||||
| Jan | 64 | 0 | 0 | 0 | 64 | Nil | Nil |
| Feb | 64 | 0 | 0 | 0 | 64 | Nil | Nil |
| Mar | 64 | 0 | 0 | 0 | 64 | Nil | Nil |
| Apr | 33 | 25 | 5 | 1 | 64 | 1. So Kwun Wat (32.2%) 2. Sai Kung Town (31.1%) 3. Lai King (22.9%) 4. Tsuen Wan West (22.1%) 5. Tuen Mun West (21.3%) |
1. Ngau Liu & Muk Min Shan (55.3%) |
| May | 3 | 42 | 17 | 2 | 64 | 1. Sheung Shui (34.5%) 2. So Kwun Wat (33.3%) 3. Fanling (32.5%) 4. Yuen Long Town (31.2%) 5. Sai Wan (29.0%) |
1. Ngau Liu & Muk Min Shan (44.0%) 2. Sai Kung Town (40.4%) |
| Jun | 1 | 44 | 19 | 0 | 64 | 1. Shau Kei Wan & Sai Wan Ho (33.9%) 2. Ma Wan (30.6%) 3. Tseung Kwan O North (29.9%) 4. Deep Water Bay & Repulse Bay (28.0%) 5. Sheung Kwai Chung (27.5%) |
Nil |
| Jul | 1 | 45 | 2 | 0 | 64 | 1. Sheung Shui (22.6%) 2. Shau Kei Wan & Sai Wan Ho (20.0%) |
Nil |
| Aug | 32 | 32 | 0 | 0 | 64 | Nil | Nil |
Port Gravidtrap Indices and Port Density Indices for Aedes albopictus in 2023 are provided below:
| Port areas (Map) | |||||||||||||
|---|---|---|---|---|---|---|---|---|---|---|---|---|---|
| Port Area | Jan | Feb | Mar | Apr | May | Jun | Jul | Aug | Sep | Oct | Nov | Dec | |
| Hong Kong International Airport | PGI | 0.0 | 0.0 | 0.0 | 0.4 | 0.6 | 0.8 | 0.4 | |||||
| PDI | N/A | N/A | N/A | 1.0 | 1.0 | 1.2 | 1.2 | ||||||
| Cross Boundary Check Points on Land | PGI | 0.2 | 0.0 | 0.1 | 5.6 | 12.1 | 9.1 | 3.0 | |||||
| PDI | 1.0 | N/A | 1.0 | 1.3 | 1.5 | 1.2 | 1.4 | ||||||
| Private Cargo Working Areas | PGI | 0.0 | 0.0 | 0.0 | 4.1 | 17.2 | 12.5 | 4.4 | |||||
| PDI | N/A | N/A | N/A | 1.0 | 1.5 | 1.5 | 1.4 | ||||||
| Cross Boundary Ferry Terminals | PGI | 0.0 | 0.0 | 0.0 | 0.0 | 1.8 | 3.0 | 2.7 | |||||
| PDI | N/A | N/A | N/A | N/A | 1.2 | 1.0 | 1.0 | ||||||
| Container Terminals | PGI | 0.0 | 0.0 | 0.0 | 0.3 | 1.5 | 1.3 | 0.3 | |||||
| PDI | N/A | N/A | N/A | 1.0 | 1.0 | 1.0 | 1.0 | ||||||
| Public Cargo Working Areas | PGI |
0.0 |
0.2 | 0.0 | 3.4 | 9.3 | 15.5 | 8.9 | |||||
| PDI | N/A | 1.0 | N/A | 1.1 | 1.2 | 1.5 | 1.2 | ||||||
Remarks:
Gravidtrap Index figures in green: Level I : Gravidtrap Index <5.0% (indicates that the distribution of Aedes albopictus in the survey area is not extensive)
Gravidtrap Index figures in yellow: Level II : 5.0% ≤ Gravidtrap Index <20.0% (indicates that the distribution of Aedes albopictus in the survey area is fairly extensive)
Gravidtrap Index figures in red: Level III : 20.0%≤ Gravidtap Index <40.0% ( indicates that the distribution of Aedes albopictus in the survey area is extensive)
Gravidtrap Index figures in purple: Level IV : Gravidtrap Index ≥40.0% (indicates that the distribution of Aedes albopictus is very extensive)
Density Index figures in green: Level I : 1.0 ≤ Density Index ≤ 1.5 (Aedes albopictus is not abundant in the locations with positive Gravidtraps)
Density Index figures in yellow: Level II : 1.6 ≤ Density Index ≤ 2.4 (Aedes albopictus is slightly abundant in the locations with positive Gravidtraps)
Density Index figures in red: Level III : Density Index ≥ 2.5 (Aedes albopictus is abundant in the locations with positive Gravidtraps)
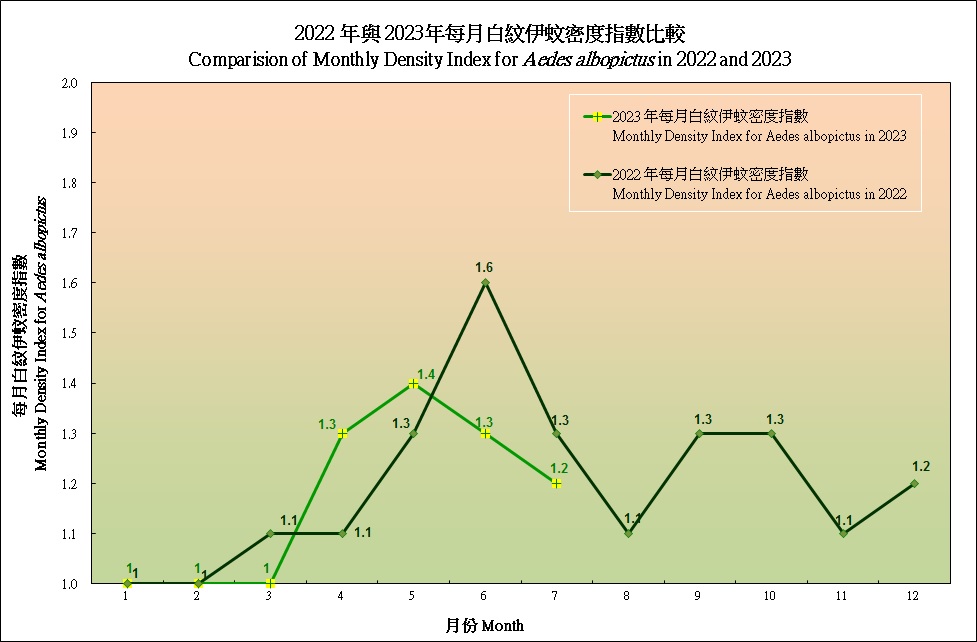
The comparison of Monthly Gravidtrap Index and Monthly Density Index for Aedes albopictus between 2022 and 2023 are shown below.
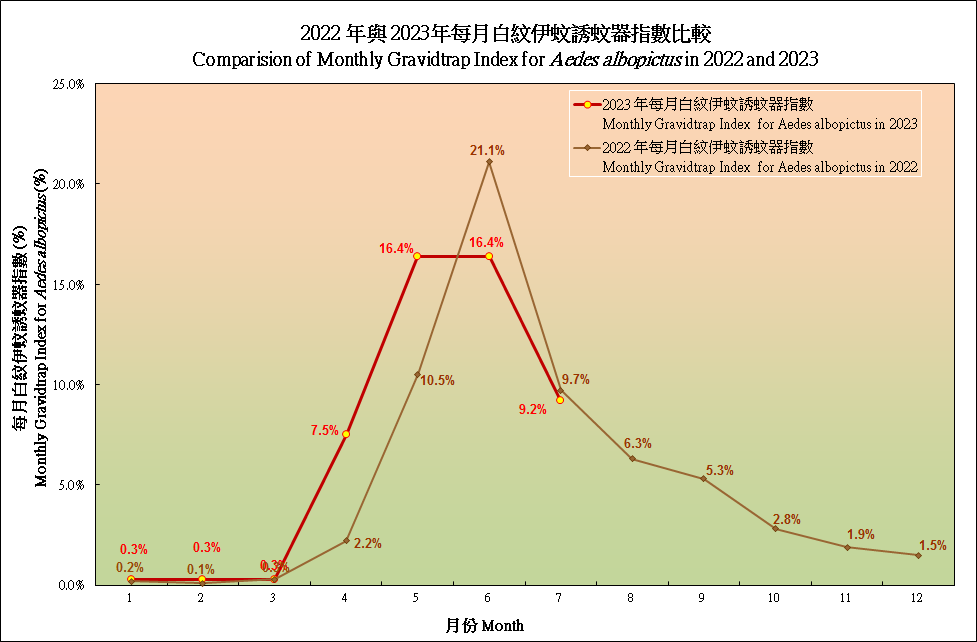
The Monthly Gravidtrap Index for Aedes albopictus for July 2023 is 9.2%.
The Monthly Density Index for Aedes albopictus for July 2023 is 1.2.
The Port Monthly Gravidtrap Index for Aedes albopictus for July 2023 is 1.9%.
The Port Monthly Density Index for Aedes albopictus for July 2023 is 1.3.
For historical information in respect of the previous ovitrap indices, please refer to the followings:
Please click here for the Monthly Ovitrap Index, Gravidtrap Index and Density Index for Aedes albopictus from 2013 to 2022.
Please click here for a graph of comparison of Monthly Ovitrap Index for Aedes albopictus: 2010 to 2019 and 2020.
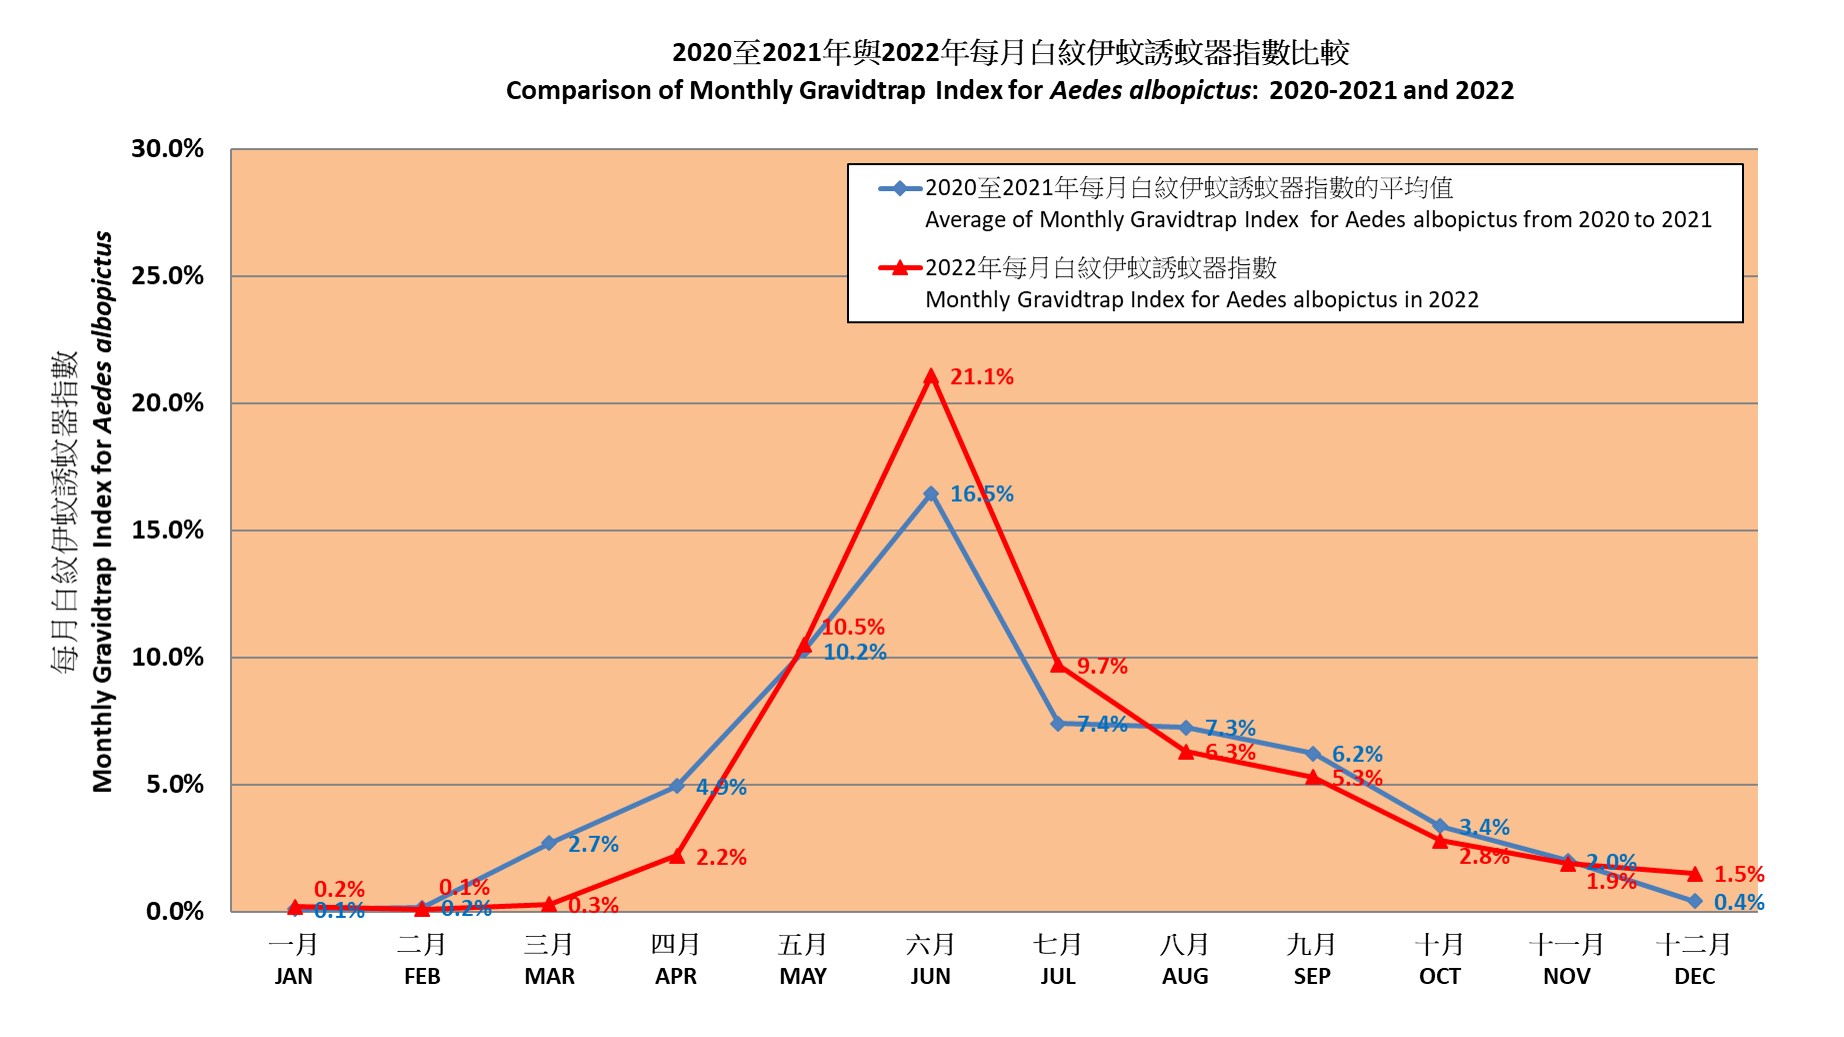
Please click here for a graph of comparison of Monthly Gravidtrap Index for Aedes albopictus: 2020 to 2021 and 2022.
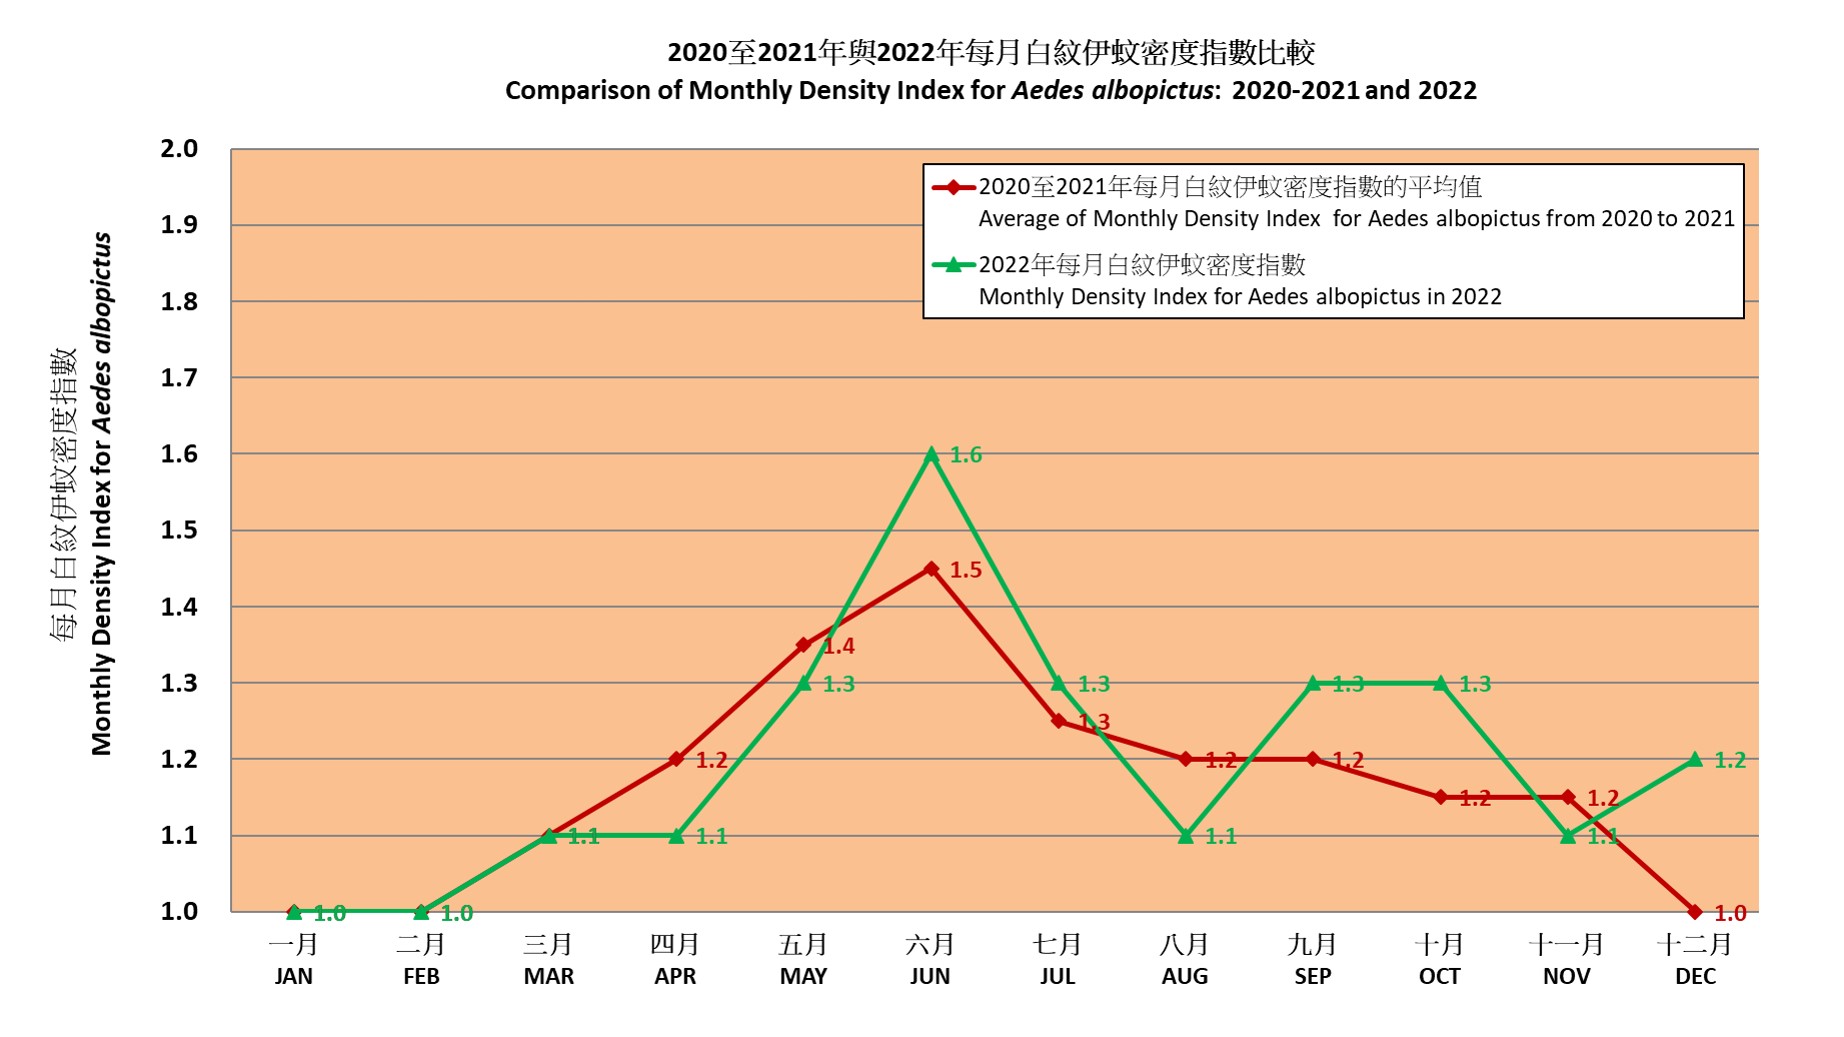
Please click here for a graph of comparison of Monthly Density Index for Aedes albopictus: 2020 to 2021 and 2022.
Please click here for the Port Monthly Ovitrap Index, Gravidtrap Index and Density Index for Aedes albopictus from 2013 to 2022