At present, there are a total of 62 survey areas selected for the vector surveillance throughout the territory and the following four different indices will be enumerated:
- Area Gravidtrap Index for Aedes albopictus (AGI),
- Area Density Index for Aedes albopictus (ADI),
- Monthly Gravidtrap Index for Aedes albopictus (MGI), and
- Monthly Density Index for Aedes albopictus (MDI).
Please click here for details of Gravidtrap survey methodology
Brief of Gravidtrap Indices and Density Indices in April 2026
|
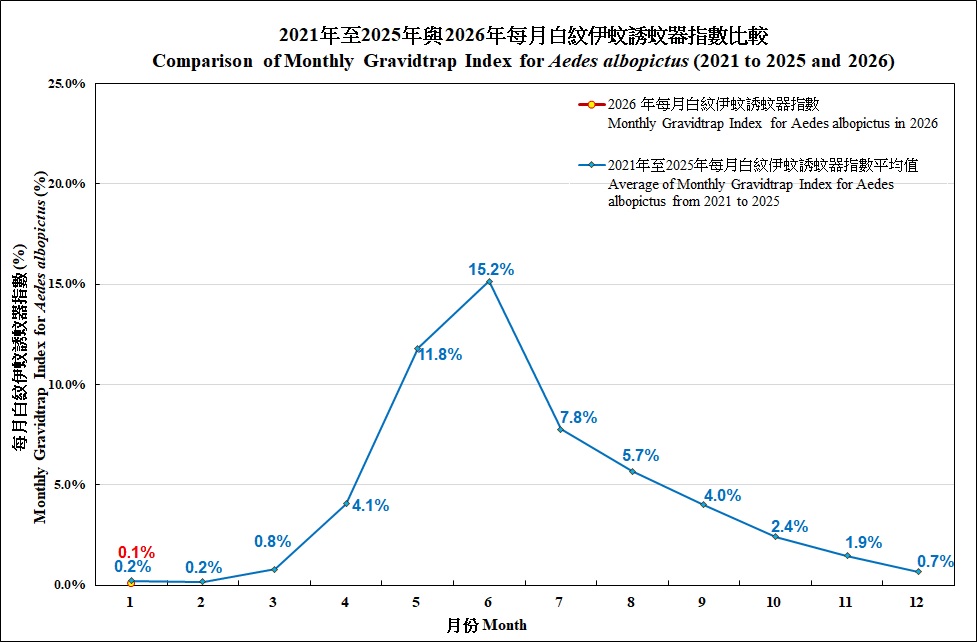
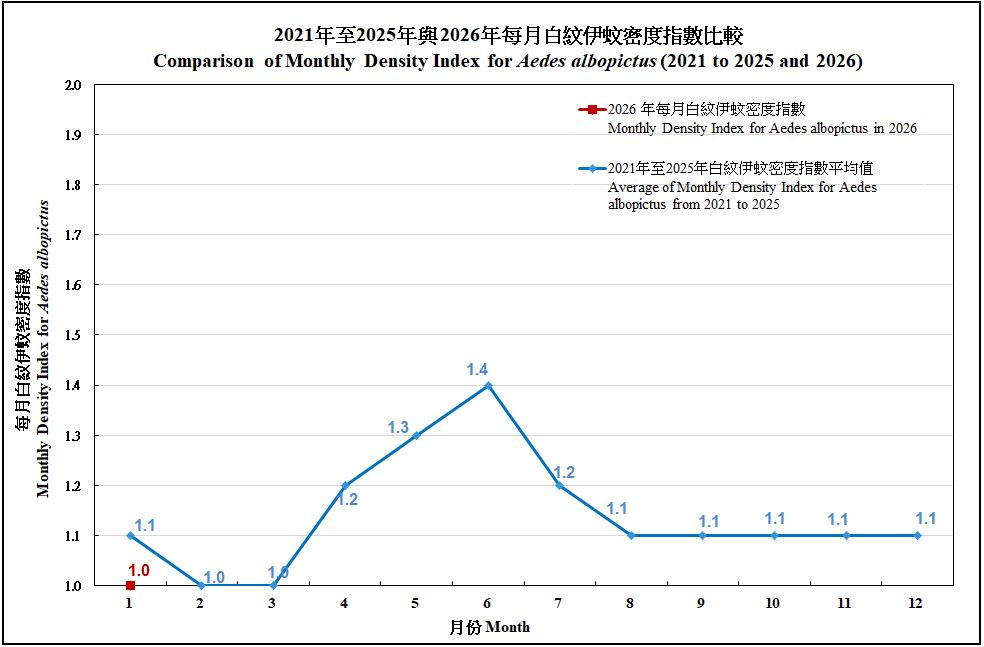
The Monthly Gravidtrap Index for Aedes albopictus mosquitoes in April was 7.9 per cent, at Level 2, indicating that the distribution of Aedes albopictus mosquitoes in the survey areas was fairly extensive. In April, among the 62 survey areas, the Area Gravidtrap Indexes in Tai Po East and Sheung Shui exceeded 20 per cent, reaching the Level 3 alert level. Moreover, the Monthly Density Index for Aedes albopictus in April was 1.3, which represented that an average of 1.3 Aedes albopictus adults were found in the Aedes-positive Gravidtraps, indicating that the number of adult Aedes albopictus was not abundant in the survey areas. |
The phased Gravidtrap Indices and Density Indices for Aedes albopictus for each surveyed area in May 2026 are provided below:
| Hong Kong Island | |||||
|---|---|---|---|---|---|
|
District |
Survey area |
First Phase Gravidtrap Index | First Phase Density Index | Area Gravidtrap Index | Area Density Index |
| Central and Western | Central and Admiralty | ||||
| Kennedy Town and Shek Tong Tsui | 20.8% | 1.2 | 16.8% | 1.3 | |
| Sheung Wan and Sai Ying Pun | |||||
| Eastern | Chai Wan | 11.5% | 1.0 | 15.4% | 1.0 |
| North Point and Quarry Bay | 24.6% | 1.5 | 18.9% | 1.4 | |
| Shau Kei Wan and Sai Wan Ho | 9.1% | 1.4 | |||
| Southern | Aberdeen and Ap Lei Chau | 31.5% | 1.9 | 20.8% | 1.7 |
| Deep Water Bay and Repulse Bay | |||||
| Pok Fu Lam | 13.8% | 1.1 | |||
| Wan Chai | Happy Valley and Tai Hang | ||||
| Tin Hau and Causeway Bay | 7.8% | 1.3 | 8.8% | 1.3 | |
| Wan Chai | 5.4% | 1.3 | 5.5% | 1.3 | |
| Islands | |||||
| Islands | Cheung Chau | 9.3% | 1.4 | 12.0% | 1.5 |
| Tung Chung | 2.0% | 1.0 | |||
| Kowloon | |||||
|---|---|---|---|---|---|
| District | Survey area | First Phase Gravidtrap Index | First Phase Density Index | Area Gravidtrap Index | Area Density Index |
| Kowloon City | Ho Man Tin | 25.0% | 1.2 | ||
| Hung Hom and To Kwa Wan | 6.7% | 1.5 | |||
| Kai Tak | |||||
| Kowloon City | 7.4% | 1.0 | 10.3% | 1.0 | |
| Kowloon Tong | 12.9% | 1.3 | 23.4% | 1.4 | |
| Kwun Tong | Kowloon Bay | 22.8% | 1.2 | ||
| Kwun Tong Central | 13.6% | 1.5 | 37.3% | 2.2 | |
| Lam Tin and Sau Mau Ping | 13.8% | 1.1 | 27.7% | 1.7 | |
| Yau Tong and Cha Kwo Ling | 28.8% |
1.8 |
|||
| Mong Kok | Mong Kok and Tai Kok Tsui | 0.0% | N/A | 0.9% | 1.0 |
| Sham Shui Po | Cheung Sha Wan | ||||
| Lai Chi Kok | |||||
| Sham Shui Po and Shek Kip Mei | |||||
| Wong Tai Sin | Diamond Hill and Tsz Wan Shan | ||||
| Ngau Chi Wan and San Po Kong | |||||
| Wong Tai Sin East | 17.0% | 1.3 | 16.7% | 1.3 | |
| Wong Tai Sin West | 24.5% | 1.6 | |||
| Yau Tsim | Tsim Sha Tsui and Yau Ma Tei | 4.7% | 2.0 | 4.8% | 2.0 |
| Tsim Sha Tsui East and King's Park | 9.1% | 1.0 | 9.1% | 1.4 | |
| New Territories | |||||
|---|---|---|---|---|---|
| District | Survey area | First Phase Gravidtrap Index | First Phase Density Index | Area Gravidtrap Index | Area Density Index |
| North | Fanling North | 14.3% | 1.0 | 13.1% | 1.5 |
| Fanling South | 7.0% | 1.7 | 14.9% | 1.4 | |
| Sheung Shui | |||||
| Sai Kung | Sai Kung Town | ||||
| Tseung Kwan O East | |||||
| Tseung Kwan O North | |||||
| Tseung Kwan O West | |||||
| Sha Tin | Ma On Shan | ||||
| Sha Tin East | |||||
| Sha Tin Town Centre and Fo Tan | 18.2% | 1.4 | 18.3% | 1.4 | |
| Tai Wai | 46.0% | 1.7 | 24.2% | 1.7 | |
| Tai Po | Tai Po East | 2.2% | 2.0 | ||
| Tai Po West | 15.5% | 1.0 | |||
| Kwai Tsing | Kwai Chung East | ||||
| Kwai Chung West | |||||
| Lai King | |||||
| Tsing Yi North | |||||
| Tsing Yi South | 12.3% | 1.1 | 15.0% | 1.1 | |
| Tseun Wan | Ma Wan and Sham Tseng | 31.5% | 1.8 | 26.2% | 1.7 |
| Sheung Kwai Chung | 7.4% | 1.3 | 10.3% | 1.5 | |
| Tsuen Wan Town | 8.8% | 2.4 | 6.9% | 2.3 | |
| Tsuen Wan West | |||||
| Tuen Mun | So Kwun Wat | ||||
| Tuen Mun North | 9.5% | 1.2 | 9.4% | 1.1 | |
| Tuen Mun South | 9.1% | 1.4 | |||
| Tuen Mun West | |||||
| Yuen Long | Hung Shui Kiu and Ping Shan | ||||
| Tin Shui Wai | 8.0% | 1.0 | 13.0% | 1.0 | |
| Yuen Long Town | |||||
| Colour | Gravidtrap Index | Density Index |
| Green:Level I | Gravidtrap Index < 5.0% [indicates that the distribution of Aedes albopictus is not extensive] | 1.0 ≤ Density Index ≤ 1.5 [Aedes albopictus is not abundant in the locations with positive Gravidtraps] |
| Yellow:Level II | 5.0% ≤ Gravidtrap Index < 20.0% [indicates that the distribution of Aedes albopictus is fairly extensive] | 1.6 ≤ Density Index ≤ 2.4 [Aedes albopictus is slightly abundant in the locations with positive Gravidtraps] |
| Red:Level III | 20.0% ≤ Gravidtrap Index < 40.0% [indicates that the distribution of Aedes albopictus is extensive] |
Density Index ≥ 2.5 [Aedes albopictus is abundant in the locations with positive Gravidtraps] |
| Purple:Level IV | Gravidtrap Index ≥ 40.0% [indicates that the distribution of Aedes albopictus is very extensive] |
Number of areas in respective levels of Survey Area Gravidtrap Indices in 2026 are provided below:
| Number of survey areas recorded with respective Index Level | Total number of survey areas | Top 5 survey areas at level 3 | Top 5 survey areas at level 4 | ||||
|---|---|---|---|---|---|---|---|
| Level 1 | Level 2 | Level 3 | Level 4 | ||||
| 0%-<5% | 5%-<20% | 20%-<40% | ≥40% | ||||
| Jan | 62 | 0 | 0 | 0 | 62 | Nil | Nil |
| Feb | 62 | 0 | 0 | 0 | 62 | Nil | Nil |
| Mar | 61 | 1 | 0 | 0 | 62 | Nil | Nil |
| Apr | 19 | 41 | 2 | 0 | 62 | 1. Tai Po East 2. Sheung Shui |
Nil |
Number of survey areas recorded with Area Gravidtrap Index reaching level III and Level IV in 2026 is provided below:
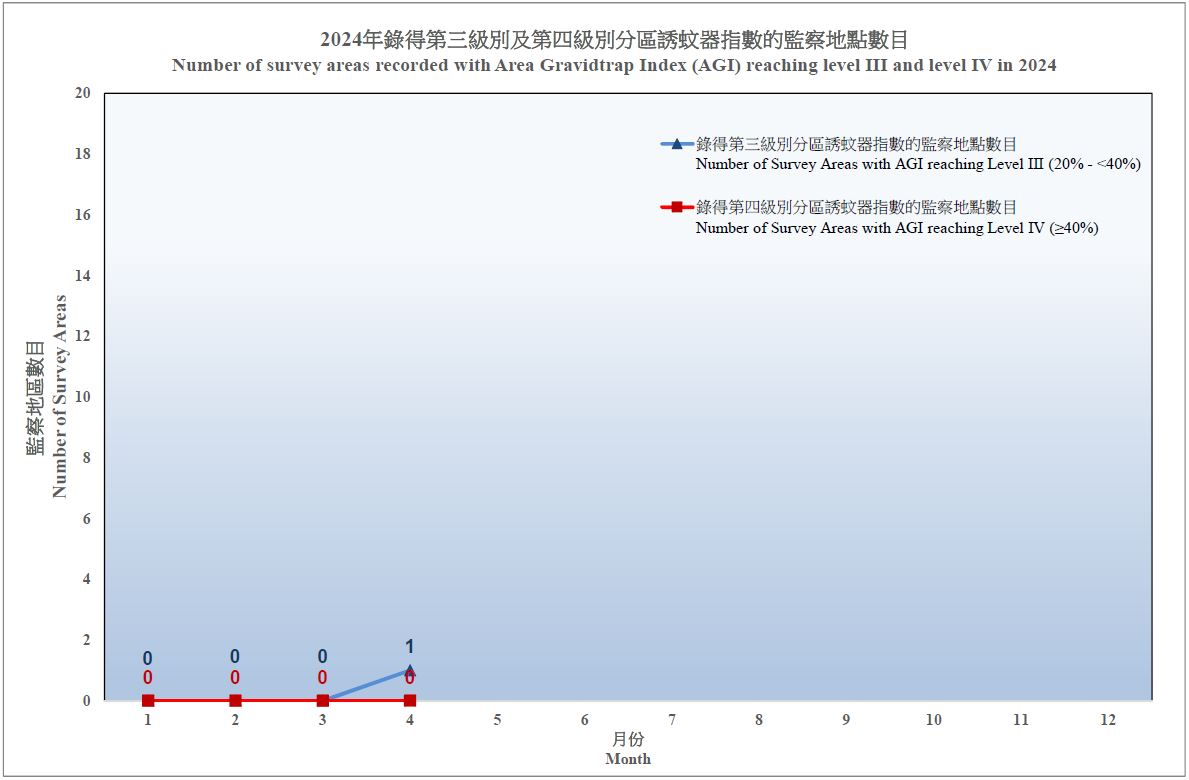
Please click here for annual hotspot map on survey locations with Area Gravidtrap Index (AGI) reaching Level III and Level IV.
Comparison of Monthly Gravidtrap Index and Monthly Density Index for Aedes albopictus (2021 to 2025 and 2026) are provided below:
Please click here for Record of Indices in 2026.
Information of Major Port Areas
The Port Monthly Gravidtrap Index and the Port Monthly Density Index for Aedes albopictus for April 2026 are 1.2% and 1.1 respectively.
Port Gravidtrap Indices and Port Density Indices for Aedes albopictus in 2026 are provided below:
| Port areas (Map) | |||||||||||||
|---|---|---|---|---|---|---|---|---|---|---|---|---|---|
| Port Area | Jan | Feb | Mar | Apr | May | Jun | Jul | Aug | Sep | Oct | Nov | Dec | |
| Hong Kong International Airport | PGI | 0.1% | 0.0% | 0.0% | 0.04% | ||||||||
| PDI | 1.0 | N/A | N/A | 1.0 | |||||||||
| Land Boundary Control Points | PGI | 0.2% | 0.1% | 0.3% | 3.8% | ||||||||
| PDI | 1.0 | 1.0 | 1.0 | 1.0 | |||||||||
| Private Cargo Working Areas | PGI | 0.0% | 0.0% | 1.0% | 3.0% | ||||||||
| PDI | N/A | N/A | 1.0 | 1.0 | |||||||||
| Cross Boundary Ferry Terminals | PGI | 0.0% | 0.0% | 0.0% | 0.3% | ||||||||
| PDI | N/A | N/A | N/A | 1.0 | |||||||||
| Container Terminals | PGI | 0.0% | 0.0% | 0.2% | 0.3% | ||||||||
| PDI | N/A | N/A | 1.0 | 1.5 | |||||||||
| Public Cargo Working Areas | PGI | 0.0% | 0.0% | 0.2% | 3.2% | ||||||||
| PDI | N/A | N/A | 1.0 | 1.2 | |||||||||
Index value remarks:
| Colour | Gravidtrap Index | Density Index |
| Green:Level I | Gravidtrap Index < 5.0% [indicates that the distribution of Aedes albopictus is not extensive] | 1.0 ≤ Density Index ≤ 1.5 [Aedes albopictus is not abundant in the locations with positive Gravidtraps] |
| Yellow:Level II | 5.0% ≤ Gravidtrap Index < 20.0% [indicates that the distribution of Aedes albopictus is fairly extensive] | 1.6 ≤ Density Index ≤ 2.4 [Aedes albopictus is slightly abundant in the locations with positive Gravidtraps] |
| Red:Level III | 20.0% ≤ Gravidtrap Index < 40.0% [indicates that the distribution of Aedes albopictus is extensive] |
Density Index ≥ 2.5 [Aedes albopictus is abundant in the locations with positive Gravidtraps] |
| Purple:Level IV | Gravidtrap Index ≥ 40.0% [indicates that the distribution of Aedes albopictus is very extensive] |
Historical information in respect of Ovitrap indices, Gravidtrap Indices and Density Indices
Please click here for the Monthly Ovitrap Index, Gravidtrap Index and Density Index for Aedes albopictus from 2016 to 2025.
Please click here for a graph of comparison of Monthly Ovitrap Index for Aedes albopictus: 2010 to 2019 and 2020.
Please click here for a graph of comparison of Monthly Gravidtrap Index for Aedes albopictus: 2020 to 2024 and 2025.
Please click here for a graph of comparison of Monthly Density Index for Aedes albopictus: 2020 to 2024 and 2025.
Please click here for the Port Monthly Ovitrap Index, Gravidtrap Index and Density Index for Aedes albopictus from 2016 to 2025.